Why is my Mac so slow?
Updated 18 November 2026
Short answer
Usually one app or browser tab is stuck using the CPU, memory has run out so macOS is swapping to disk, or the startup disk is nearly full. Open Activity Monitor and sort the CPU tab by % CPU first: the culprit is usually at the top.
The usual causes.
One app or browser tab is stuck on the CPU
A page that never stops running a script, a video call, an export or a sync client can hold a whole core for hours. Everything else waits its turn.
How to tellIn Activity Monitor's CPU tab, one process sits near or above 100% for minutes on end. 100% means one whole core.
Memory has run out
When apps want more memory than the Mac has, macOS moves some of it to disk and back. That shuffling is the spinning beachball.
How to tellThe Memory Pressure graph in Activity Monitor's Memory tab is yellow or red, and Swap Used is several gigabytes.
The startup disk is nearly full
macOS needs free space for swap, caches and updates. With only a few per cent free, it spends its time making room and apps slow down.
How to tellSystem Settings › General › Storage shows only a few gigabytes available.
Background work after an update
After a macOS update, a restore or a big import, Spotlight rebuilds its index and Photos goes through your library. It is heavy for a few hours and then stops on its own.
How to tellmds, mds_stores, mdworker or photoanalysisd are near the top of the CPU tab, and the Mac was updated or restored recently.
Too much starts at login
Every helper that opens at login takes some memory and CPU before you have opened anything yourself.
How to tellThe Mac is slowest in the first minutes after you log in, and the list in System Settings › General › Login Items & Extensions is long.
The Mac is hot and holding work back
When the chip gets too warm, macOS slows it on purpose until it cools.
How to tellkernel_task shows a very high % CPU, and the case is hot or the fan is loud.
Check it by hand.
Everything here is built into macOS. Activity Monitor is in Applications › Utilities, or type its name into Spotlight.
Find the busiest process
Open Activity Monitor, choose the CPU tab and click the % CPU column so the highest is on top. Watch for a minute. If one app or helper stays near 100% or more and it is yours, quit it from its own menu, or select it and use the stop button in the toolbar.
Look at memory pressure
Switch to the Memory tab. A green Memory Pressure graph is fine, however full Memory Used looks. Yellow or red with gigabytes of Swap Used means too much is open: quit the apps at the top of the Memory column, starting with a browser that holds many tabs.
Check free space
Open System Settings › General › Storage. If only a few gigabytes are available, free some space before you try anything else.
See what starts at login
Open System Settings › General › Login Items & Extensions. Remove what you don't need from Open at Login, and switch off App Background Activity for apps you no longer use.
Restart if it has been weeks
A restart clears swap and stops stray helpers. It is the honest fix when the Mac has been up for weeks and nothing above stands out.
The same job in 1MachineTool.
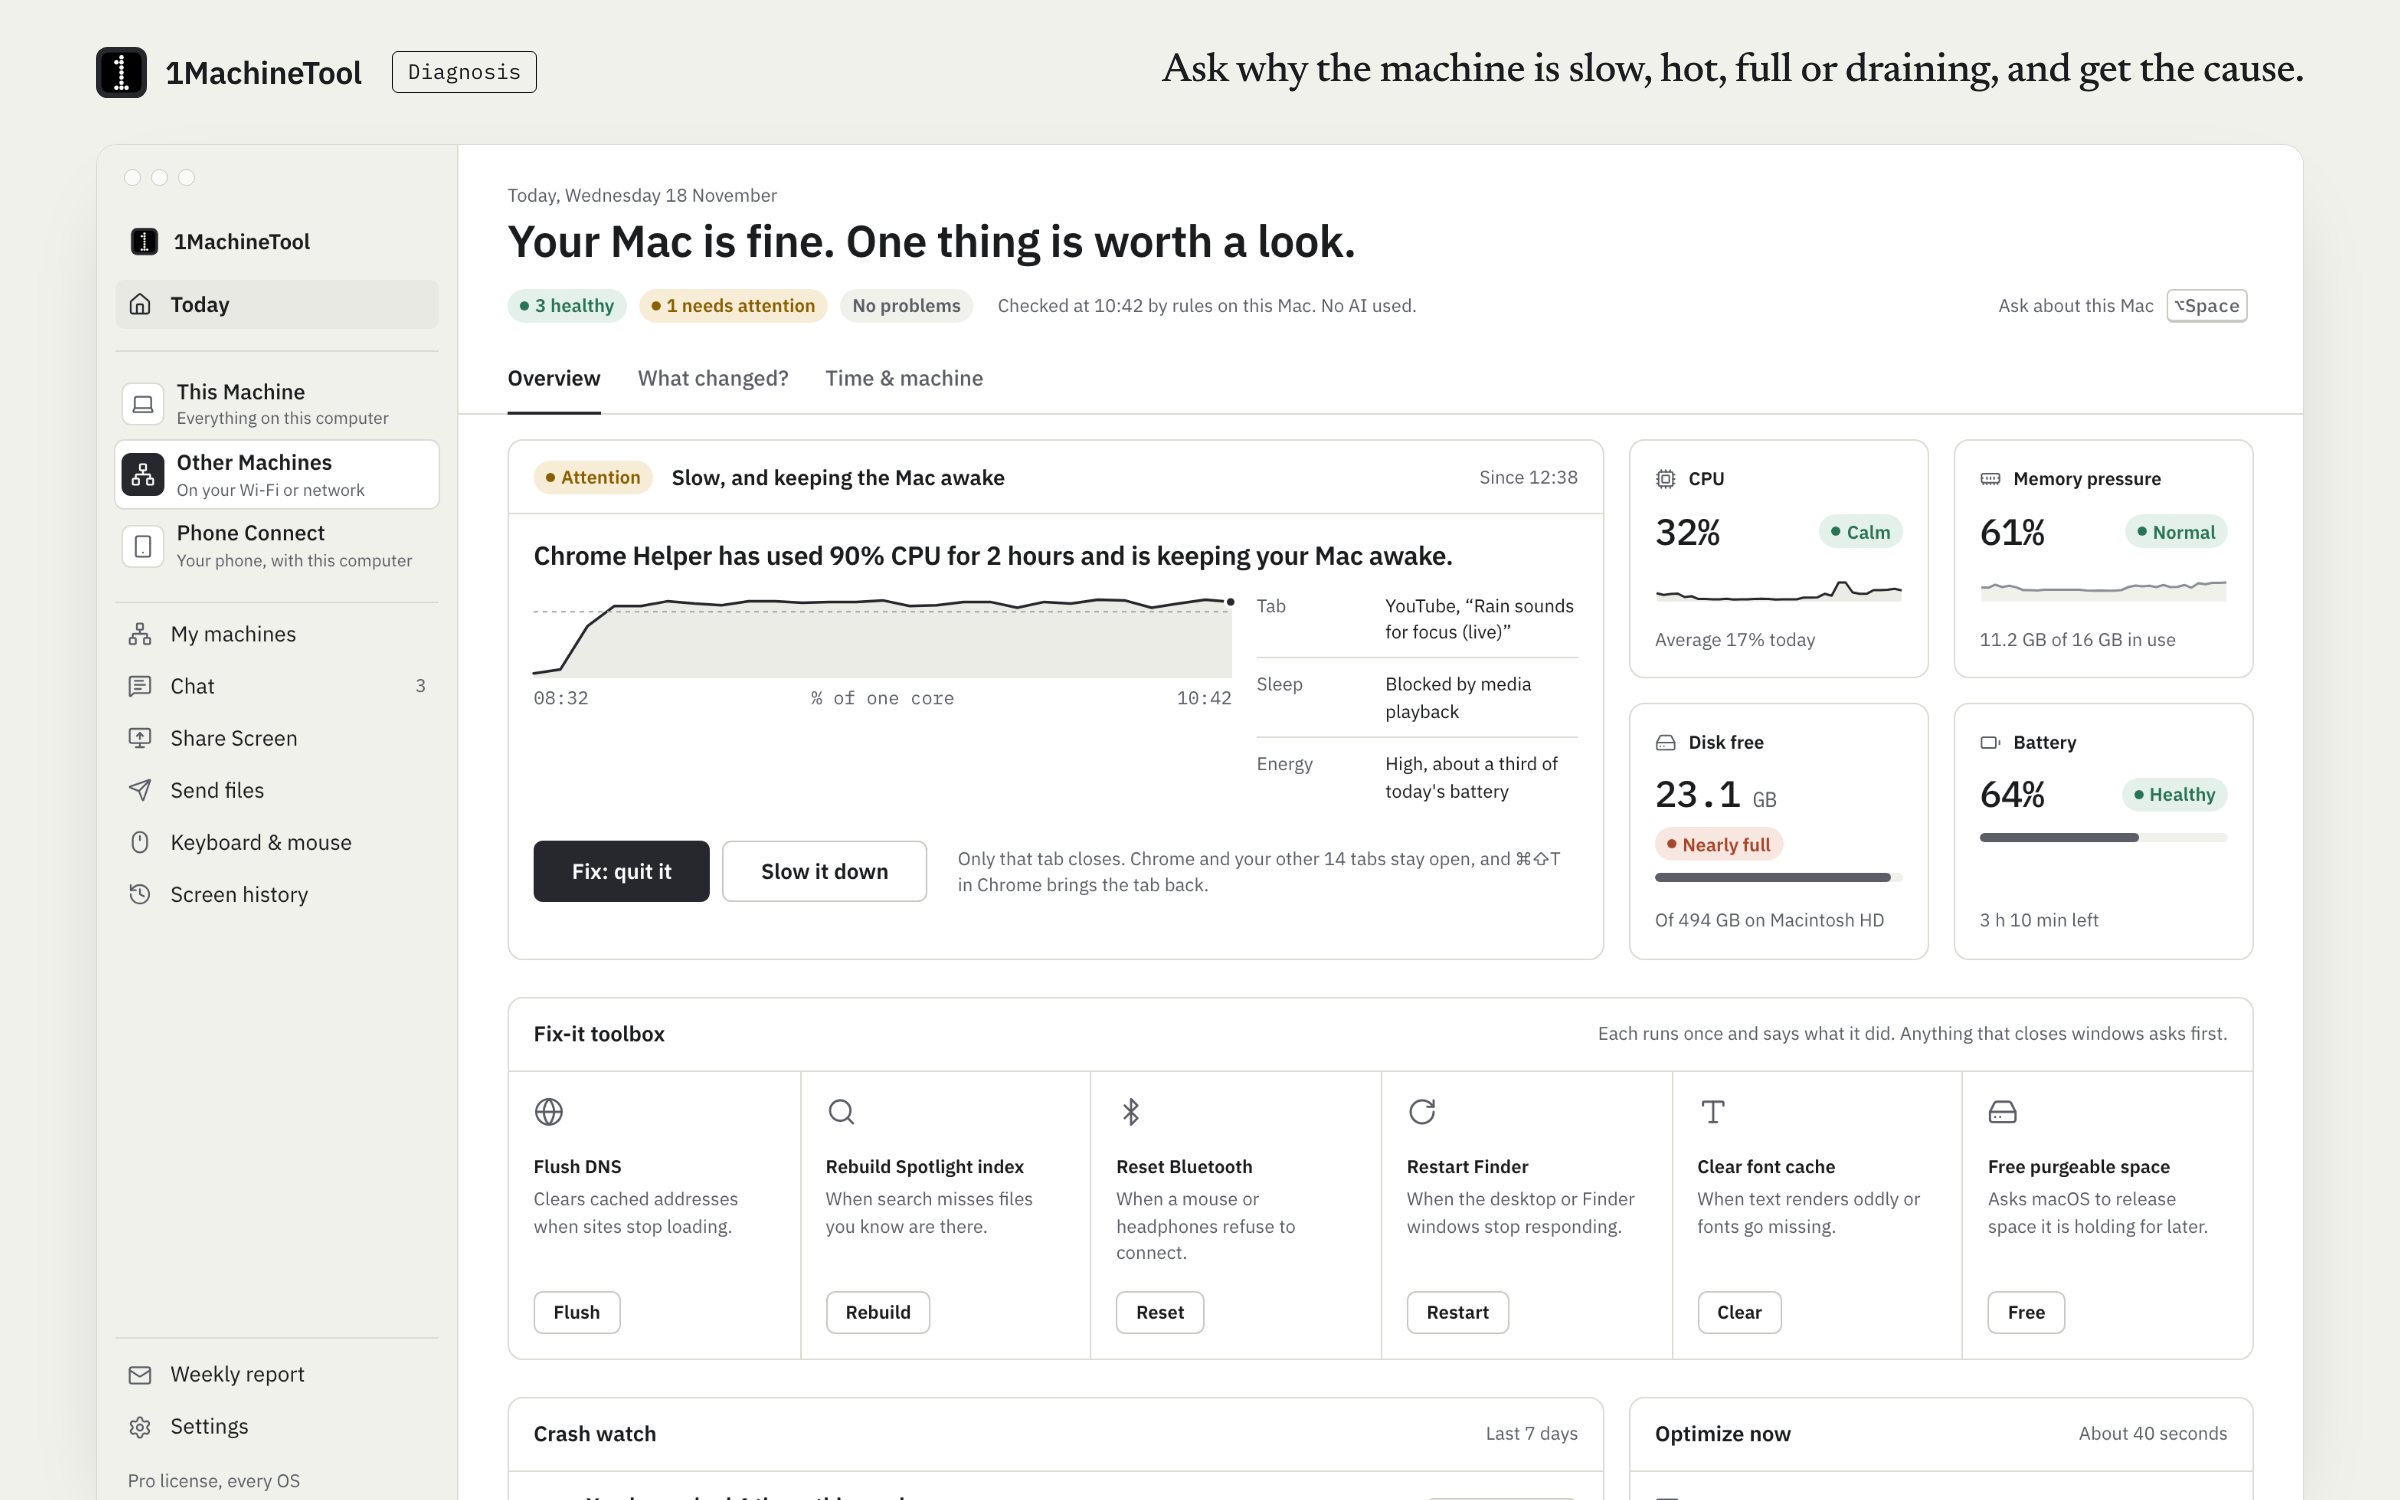
1MachineTool runs the same checks and answers in a sentence. It keeps a history of CPU and memory by process, so it can say how long something has been busy, not only that it is busy now. The rules run on your Mac and no AI is involved.
- Names any process that has held the CPU for 15 minutes or more, with how long it has been at it and a chart of that stretch.
- Says when memory is tight and which app holds the most of it. An example finding: "Chrome Helper is using 4.2 GB of memory, so macOS is swapping to disk."
- Checks free disk space, background work that settles on its own (it tells you there is nothing to fix) and how many helpers start at login.
- Offers Quit it or Slow it down on a finding, and says first what happens if you do. Slow it down lowers the process's priority and can be undone.
Asking the question and every finding are free and never counted. On Free, 3 fixes a day. Pro, $29 once for one computer, removes the daily limits.
In the launcher
why is my mac slow
In the terminal
1machine diagnose slow1MachineTool 1.7.0
On Windows and Linux.
On Windows the by-hand tool is Task Manager (Ctrl+Shift+Esc): sort Processes by CPU or Memory. On Linux, use System Monitor or top. 1MachineTool's diagnosis and monitor work on Linux, tested on Ubuntu with GNOME. The Windows build is early, and each page in the app says what works there today.
Questions.
How do I find out what is slowing my Mac without installing anything?
Open Activity Monitor from Applications › Utilities. Sort the CPU tab by % CPU, then check the Memory Pressure graph in the Memory tab, then look at free space in System Settings › General › Storage. One of the three usually explains it.
What is kernel_task, and why is it using so much CPU?
kernel_task is macOS itself. When the chip is hot, it takes CPU time on purpose so apps get less and the Mac cools down. You can't quit it. Find the app that is making the heat, and give the Mac some air.
Does a Mac slow down as it gets older?
Not by itself. Newer versions of macOS and of your apps ask more of the same hardware, disks fill up and login items pile up. Memory pressure tells you whether the Mac has run out of memory for what you now run on it.
Do I need Pro to ask why my Mac is slow?
No. The question and every finding are free, and Free includes 3 fixes a day. Pro is $29 once for one computer and removes the daily limits.