Monitor · Upkeep
See what is using your CPU and memory, by name.
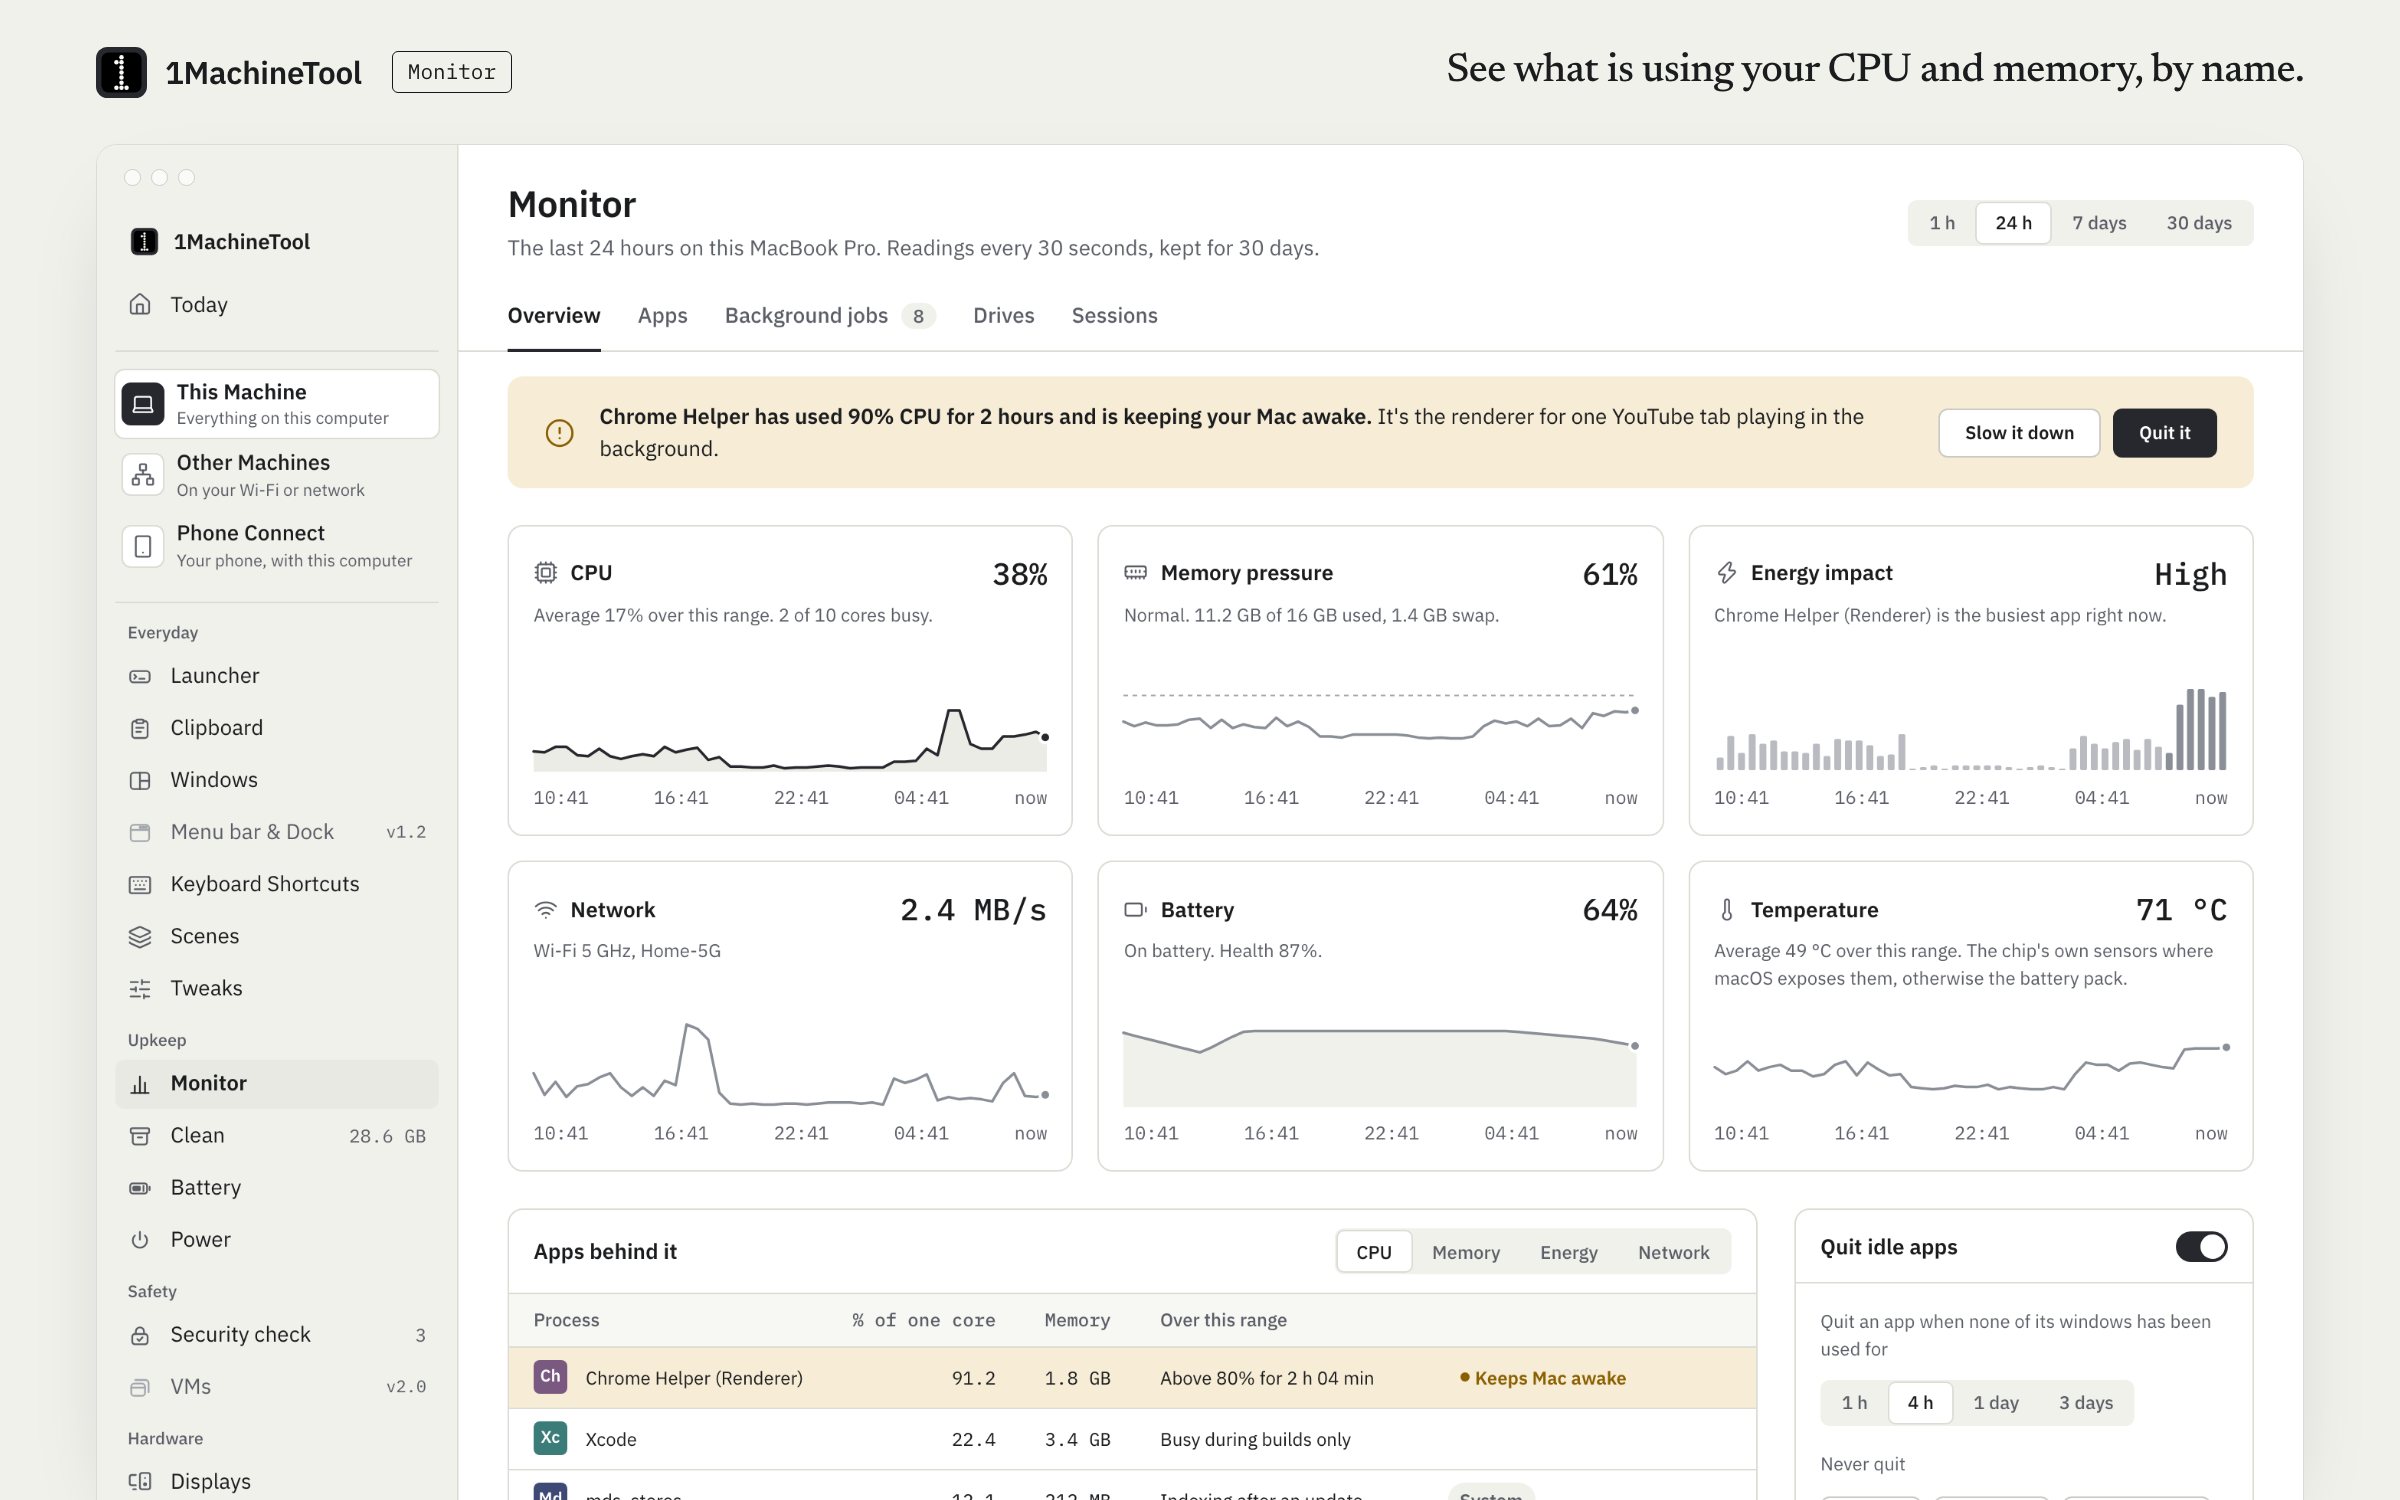
Monitor shows CPU, memory, disk, network, battery and temperature with their history, and names the apps behind the load. A reading is taken every 30 seconds and kept for 30 days. It is free and never counted.
Checked against 1MachineTool 1.7.0, 18 November 2026
What it does.
- A readout in the menu bar
- One tray icon with CPU %, which becomes an attention mark when something needs a look. An optional notch readout shows CPU, battery, memory and network around the camera notch.
- Hogs, by name
- The apps using the most CPU, memory, energy or network over the last hour, day, week or month.
- History
- Each reading keeps its history, so you can see when a slow spell began.
- Background jobs and USB
- What runs in the background, and what is plugged in.
- Drive health and temperatures
- The SMART verdict for each drive, with wear and errors when smartctl is installed, and chip temperatures read without a kernel driver.
- Performance sessions
- Record one sample a second while something runs, and get summary sentences when you stop.
- Quit idle apps
- Optionally quit apps you have not used for a while. It is off until you turn it on.
How you use it.
- Glance at the tray icon for CPU %, or click it for the panel: six readings, each with the last hour underneath.
- Open Monitor to see the apps behind a reading.
- Quit or slow the one in the way, or ask the launcher why the machine is slow.
From the terminal
1machine status- CPU, memory, disk, network, battery and temperature right now.
1machine hogs --by memory --range 24h- The apps using the most memory over the last day. Also cpu, energy and network.
1machine drives- Drive health and chip temperatures.
1machine perf start Export- Starts a performance session; `1machine perf stop` ends it and prints the summary.
Free and Pro.
Free
All of it. The monitor is never counted. Quitting or slowing a process from a finding uses one of the 3 daily fixes.
On your computer.
- macOS
- Readout and history, hogs, background jobs, the USB panel, quit idle apps, drive health, chip temperatures and performance sessions.
- Windows
- Early build. Programs show with the icon Windows gives them; the Monitor page in the app says what else works there today.
- Linux
- hwmon temperatures, UDisks2 drive health, PSI memory pressure, and systemd user units and autostart entries as background jobs.
What it doesn’t do.
- It does not show fan speed or GPU load.
- Drive wear and error counts need smartctl installed; without it you get the SMART verdict only.
- History goes back 30 days.
Questions.
Is the system monitor free?
Yes. The readout, the history, the hogs list, drive health and temperatures are free and never counted.
Does it need a kernel extension to read temperatures?
No. On a Mac it reads chip temperatures through IOHIDEventSystem, with no driver, and on Linux it reads hwmon. 1MachineTool installs no kernel drivers.
Does it show fan speed?
Not today. It shows chip temperatures, and Diagnosis can tell you what is making the machine hot.
How long is history kept?
30 days. A reading is taken every 30 seconds.